Gofard Concept
Gofard is an unlimited, free data analysis application.
Make a plan. Collect data. Discover the rules. Guide the next best move. We will equip you with analytical tools that can be used in a wide range of situations.
- GUI application for statistical computing, machine learning and operations research running in R.
- Simple UI, functionality and operation. No coding skills required.
- Easily analyze data at hand with mouse operation.
- Planning method allows you to create an efficient plan from no data at the beginning.
- Open source. Always free.
R and R Studio must be installed for use. Click here to see how to install.
The source code is available on git hub.
Gofard ver1.2 Menu
Click here to see how to prepare your analysis data.
■Data-handling
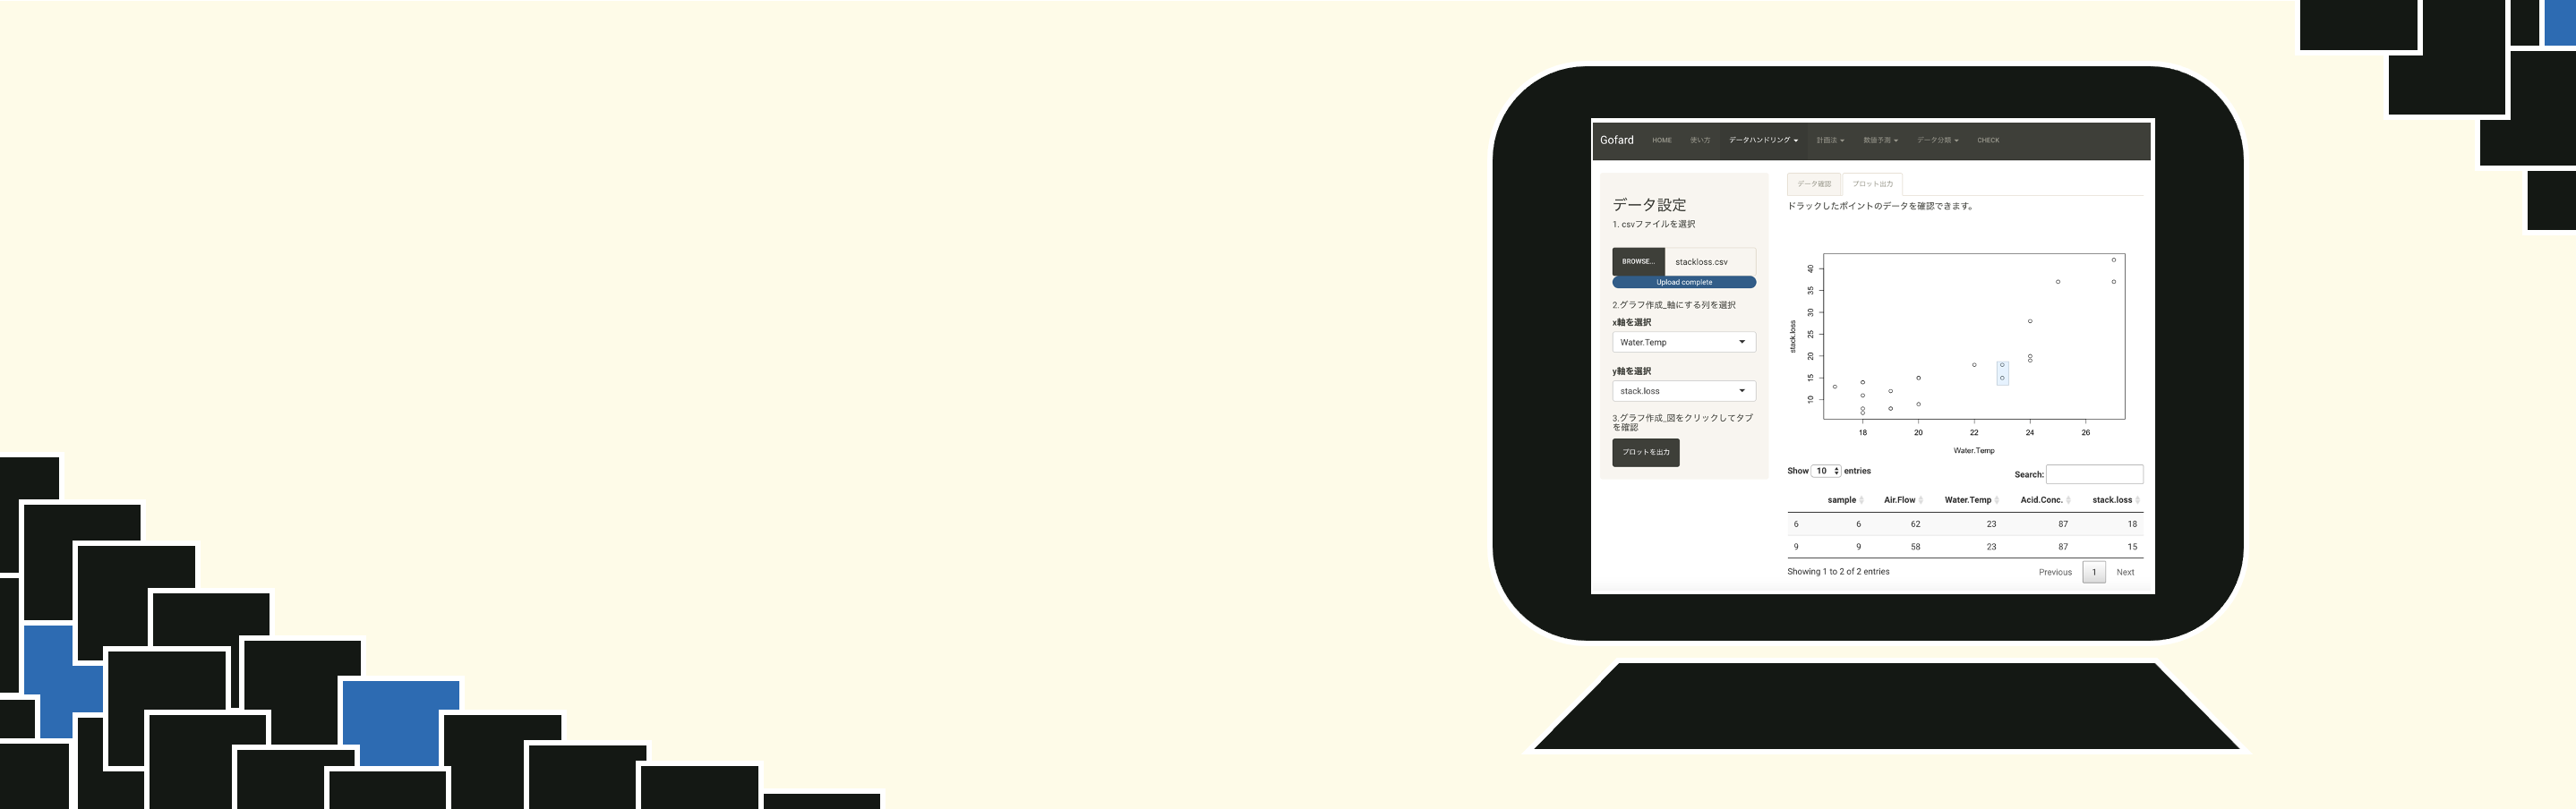
Plotting (scatter plot, bar plot, box plot and histogram): Observe the big picture of data and create easy-to-understand graphs.
Click here to learn how to use the drafting function.
Correlation matrix:Create scatterplot matrices and correlation matrices to quickly visualize the features between each element.
Click here to learn how to use the Correlation matrix.
Aggregate calculation: calculates the total, maximum, minimum, mean, median, and standard deviation of the data.
■Planning method
Creation of experimental design: A screening design with the minimum number of moves is created based on the experimental conditions using the DSD.
Click here to learn how to use Design of Experiments.
Process Planning: Calculate the time required for a project that includes multiple processes using the PERT.
Click here to learn how to use the process plan.
■Numerical prediction
Click here for an explanation of numerical forecasting (regression).
Single regression analysis: predicts one objective variable with one explanatory variable using the least squares method. Can also be used for quantitative analysis.
Click here to learn how to use single regression analysis.
Multivariate regression analysis(LASSO): predict one objective variable with multiple explanatory variables in LASSO regression. It can also be used for factor analysis and conditional optimization.
Click here to learn how to use the LASSO regression.
■Data classification
Decision Tree: Decision trees allow for the creation of tree model diagrams and analysis of data characteristics.
Click here to learn how to use the decision tree.
k-means: Classification can be performed for each sample of data with similar characteristics using the k-means.
Click here to learn how to use the k-means.
External Links
Twitter:I disseminate information about Gofard and data science in Japanese.
note:Gofard feature description and personal articles are produced irregularly in Japanese.