How to use Decision Tree
Decision Tree
GOFARD can create tree models using a classification method called decision tree.
Decision trees are useful for factor analysis of experimental results, questionnaires, etc., because they have the advantage of making the classification model easy to interpret.
Ex. Decision Tree Analysis
The following is an example of factorial analysis of three varieties of iris classification data using decision trees.
This data set consists of 50 samples each of three varieties of iris "setosa," "versicolor," and "virginica" with four measurements of "sepal" and "petal" in terms of width and length. This data set was compiled.

Load the csv file and select the columns for sepal and petal width and length as explanatory variables and the column for variety as objective variable. The "Minimum number of split samples" is left at the default value of 20.
A tree model is output to the Classification Results tab.
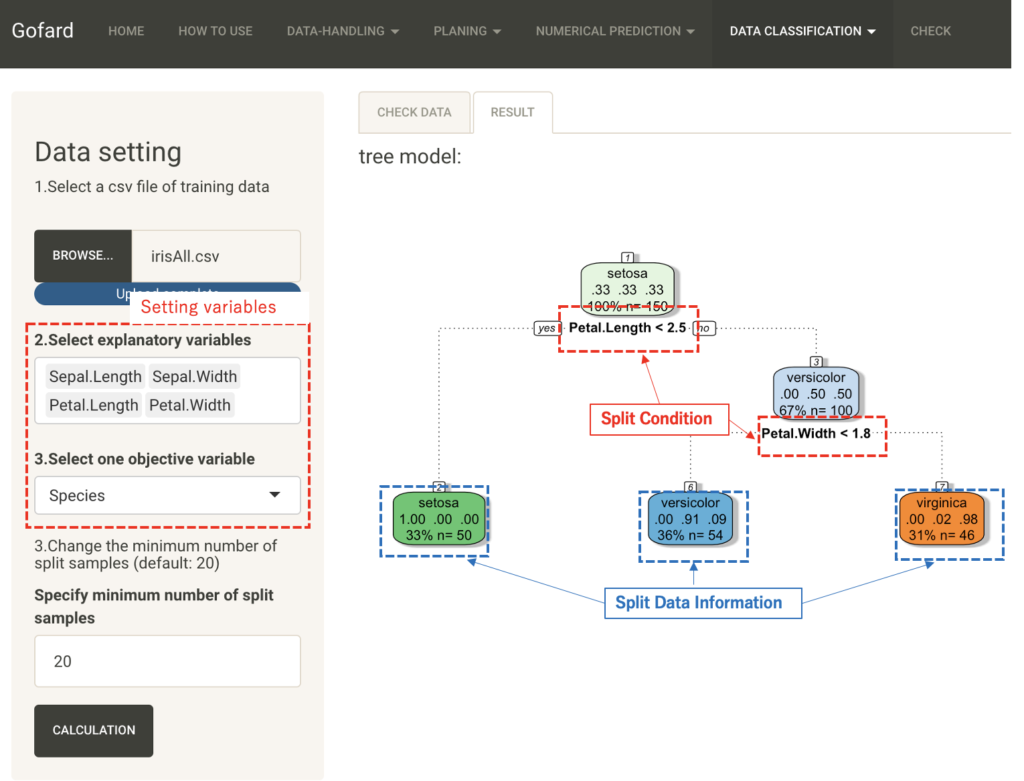
The classification results at the end of the tree show three varieties. The first line of the split data shows the type of the objective variable, the second line shows the proportion correctly classified into each of the three varieties, and the third line shows the number of samples and their overall proportion in the classified data.
The third line shows the number of samples and their overall percentage of the classified data. The branches indicate the splitting conditions of the explanatory variables.
From this figure, if the petal length is less than 2.5, it can be classified into setora species with 100%, and then, although there is a little misclassification, it is classified into the remaining two species with a threshold of 1.8 petal width.
In this way, the decision tree can visualize the important factors in the classification problem in an easy-to-understand manner.
The "Minimum number of split samples" is the set value for the minimum number of samples for each node, and the smaller this value is, the deeper the tree becomes in the hierarchical structure. Next, let's try classification with the value set to 10.
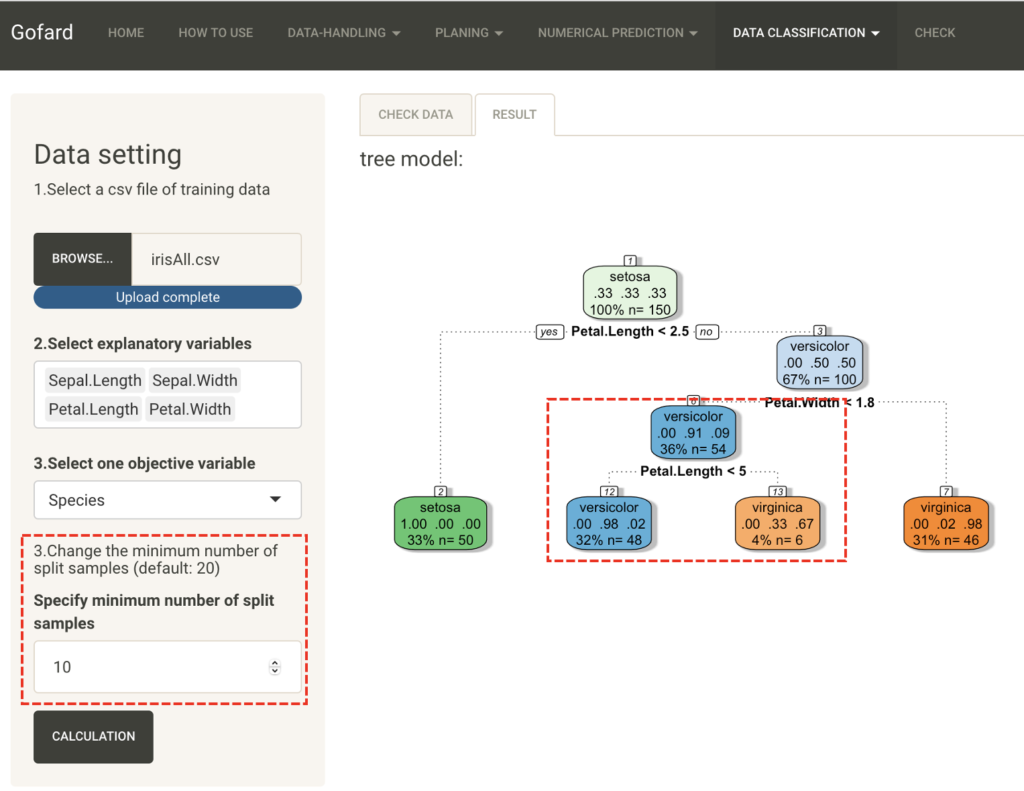
In contrast to the previous result, the second terminal node has been further divided. Change the settings as appropriate for your data and purpose to create a tree model that is easy to interpret.