How to use drawing functions
How to use drawing functions
Intuitive and easy-to-understand diagrams are important in order to efficiently explain the main information from the data. Gofard allows you to easily create scatter plots, bar charts, and box plots.
ver1.2
Scatter plot
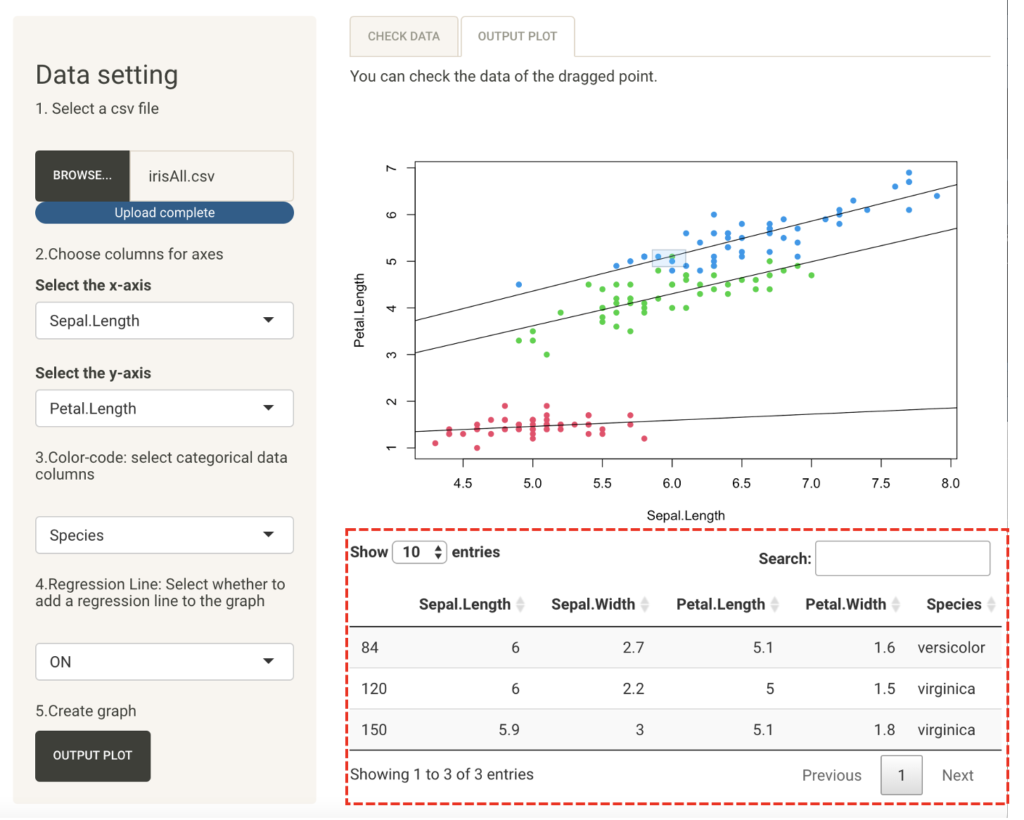
Create a scatter plot for the iris three-cultivar classification data so that you can see the characteristics of the data.
This data set contains 50 samples of each of the three iris varieties "setosa," "versicolor," and "virginica," with "sepal" and "petal" data compiled for four measurements: width, length, and petal. and length.
Input a csv file, set the numerical data columns to be displayed on the horizontal (x-axis) and vertical (y-axis) axes, and press the Plot Output button to output a plot on the Output tab.
You can also color-code the data by category data, which indicates the classification of the data.
If the regression line setting is turned on, a regression line based on the least squares method can be displayed on the scatter plots.

This makes it easier to understand the characteristics of the data for each of the three species.
You can also drag the plot with the mouse to see the details of the data.
Bar and box plot
These charts are suitable for viewing data distribution by category.
Input a csv file, set the x-axis to categorical data columns, the y-axis to data columns, and the bar chart to the statistics shown on the vertical axis, and press Plot Output to output the respective figures in the Output tab.
For bar graphs, turning on scatter points will overlay a plot of the elementary data. This makes it easy to show the characteristics of the data.

Histogram
Histograms are good for checking the distribution of each variable.
If you input a csv file, set the data column you want to check on the x-axis, and press the plot output, the figure will be output.
Furthermore, it is also possible to color code for each category data by setting "color-code". This makes it easier to understand the characteristics of the data.

All drawings can be copied and pasted to another medium. Convey information smoothly with easy-to-understand diagrams.