How to use multivariate regression analysis(LASSO)
Multivariate regression analysis(LASSO)
Multivariate regression analysis creates a model that predicts one objective variable y with multiple explanatory variables x.
Gofard allows you to run multivariate regression analysis with LASSO regression.
LASSO regression is a regression technique that combines predictive accuracy with model interpretability, as it has the ability to select the explanatory variables needed to make a prediction. It is widely used for factor analysis, parameter optimization, and more.
Ex. factor analysis of plant operation data
Let's analyze the important factors in production efficiency from the operation data of a chemical plant that produces nitrogen oxides from ammonia.
The table data includes three operating conditions: "Air Flow" (cooling air volume), "Water Temp" (cooling water temperature in the nitrogen oxide adsorption column), "Acid Conc. loss (adsorption loss of nitrogen oxides) related to production efficiency.
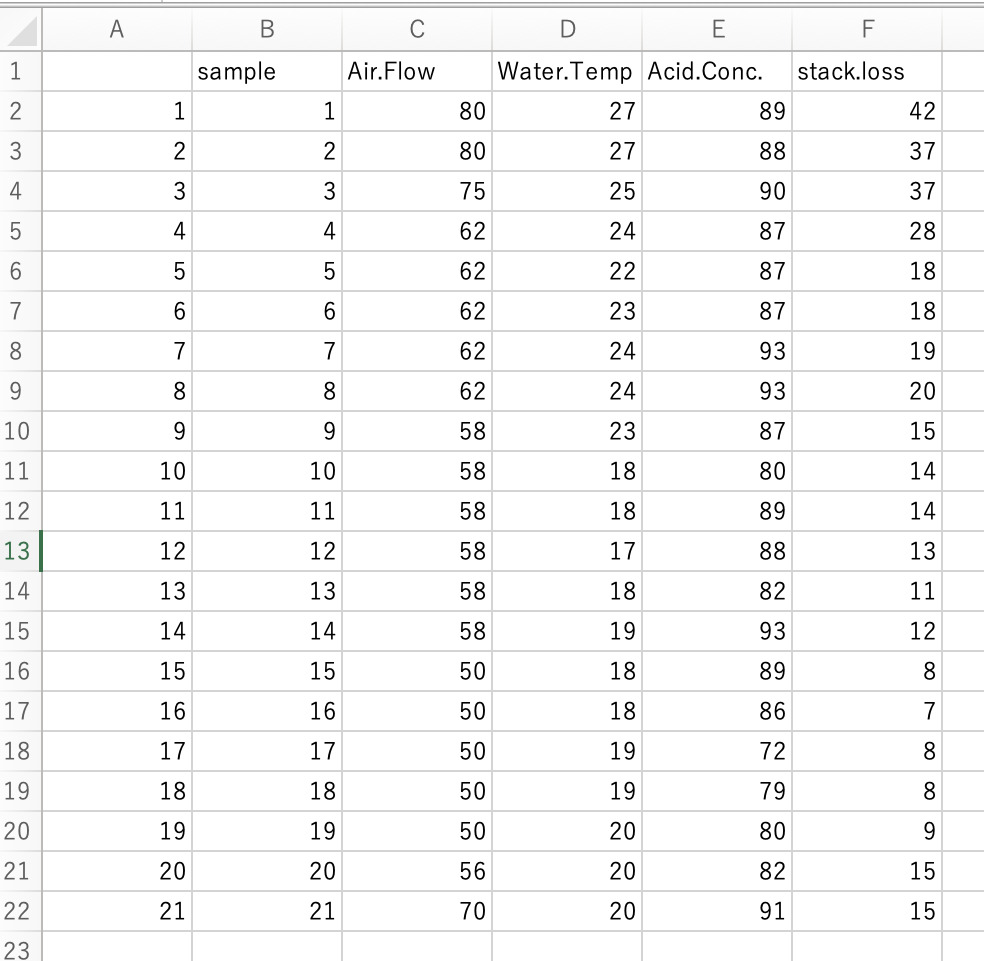
Load the csv file as training data, select the "Air Flow," "Water Temp," and "Acid Conc." columns as explanatory variables and the "stack.loss" column as objective variable, and run the calculation.
The Prediction Model Results tab allows you to check the accuracy of the forecast model, regression coefficients of explanatory variables, and compare the model's calculated values with the actual values in the list.

In addition, you can check the regression coefficients, which provide an indication of the " effect" of each explanatory variable.
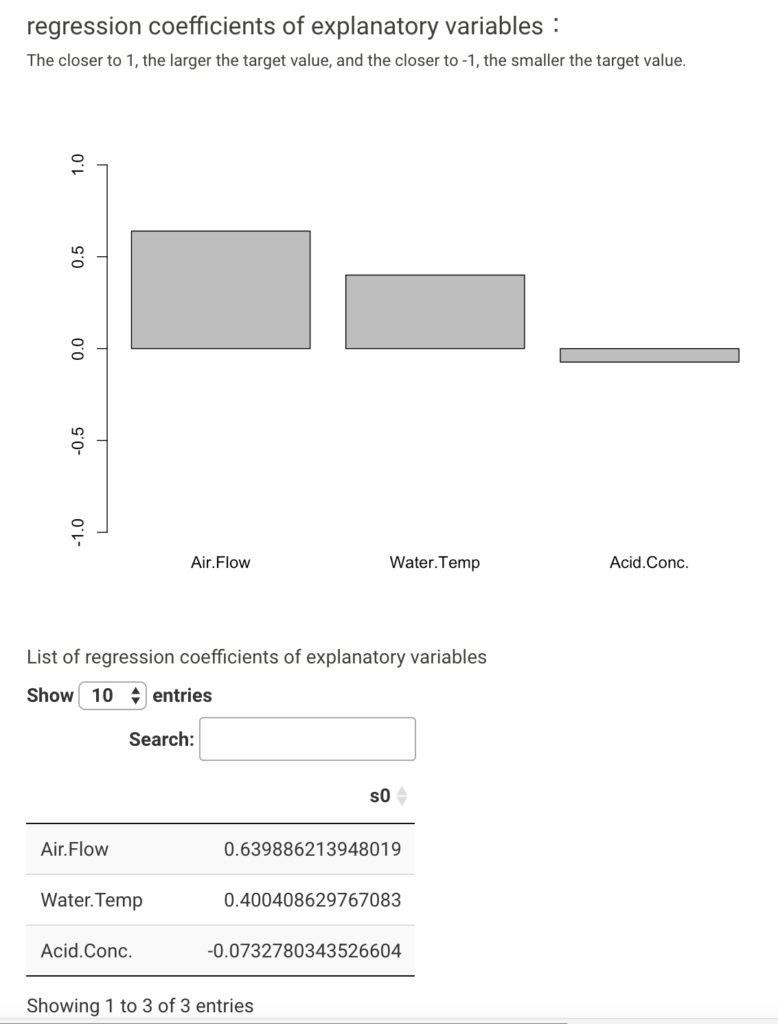
From this data set, Air Flow seems to be most positively correlated with stack.loss. In contrast, Acid Conc. is considered to have relatively little effect on stack.loss.
The results can be used to discuss whether the interpretation of the predictive model matches the actual physicochemical interpretation and whether it is practical.
Finding the optimal parameter
Assuming the above model is useful for prediction, we ask, "What are the operating conditions that will keep stack.loss stable and below 15?" based on the model.
Create a data list for forecasting with exhaustive changes to "Air Flow" and "Water Temp. Acid Conc." is fixed at 86.
Loads data for forecasting and performs calculations.
A data list containing the prediction result values is output as a prediction data list in the Forecast Data Output tab.
The result data list can be downloaded as a csv file from the bottom of the list.

Let's check this data list with the "Data Handling: Scatter Plots" tool on Gofard.
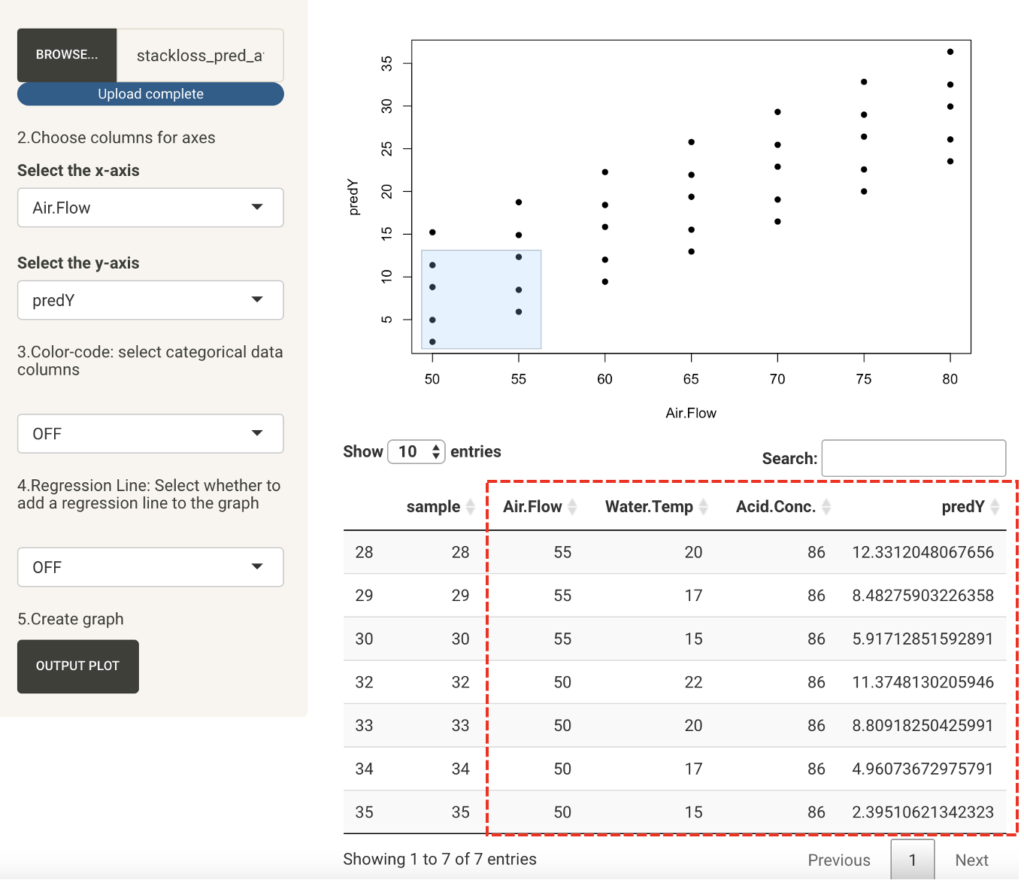
Looking at the data, we can formulate a proposal to keep Air Flow below 55 and Water Temp below 20.
If Water Temp is difficult to control, it can be determined that it is necessary to obtain data with Air Flow below 50.
In this way, multivariate analysis can make quantitative predictions for complex problems, and can perform an efficient search for a parameter.